Career - Disney Streaming - What I Done
… because a CV is too brief
Created Jun 6, 2023 - Last updated: Jun 6, 2023
Outside of usual sprint project work (Scala Functional Programming microservices), I enjoyed dabbling with different bits of tech and ideas (mostly tech/way of working related) in my time at Disney Streaming so far!
Migrating our team to Kubernetes
We were running our applications on a bespoke ECS-like platform - which worked fairly well, apart from deployments regularly failing due to nodes being too small to fit pods onto. It has health checks, self-healing properties, etc. like Kubernetes - but you can’t easily ssh into pods even in non-prod environments easily. There’s more reasons for the move, but basically there’s a company-wide effort to move to EKS.
I loved using Kubernetes (with k9s!) at Sainsbury’s, so I volunteered to lead this migration project for our team. Here’s some things I learned whilst leading this:
A shared knowledge base such as Google Docs works great. We captured key meeting notes, decisions, diagrams, etc. here.
- Anyone can get up to speed quickly
- Easy to ask questions, add comments
Creating a “team training Slack channel” for a new tech domain works great
- As you work through the training, questions, problems, and solutions crystallise
- All information is contained neatly in the channel, not spread all over various places
- It’s easier to collate key points and give feedback to the course owners
- You can expand the channel beyond just your team, sharing the benefits
For real-time knowledge sharing, encourage various people to take tickets on the work. Pair with them for smooth KT
In refinement, it can be great to call out a ticket as a pairing ticket - a “🍐” emoji in the title is a nice reminder that some felt they had something new to learn from it
I also wrote a popular internal blog post for our organisation about how to use k9s, with specific instructions for a frictionless walk-through.
CI (Jenkins)
- Consider adding a “notes” text parameter to some builds. Even if you don’t update the build description with this, it can be very useful to know why some builds were run (e.g. manual perf testing of a branch - what change, what is expected)
- For performance tests, put time-stamped links to observability platforms (DataDog, Grafana, etc.) in the output - it really helps the ergonomics of diagnosing any issues. Lower barrier to entry helps keep performance high!
- Be mindful of how many messages you’re sending to Slack, and where. If there’s just a little traffic, it can go to a visible team chat. If it’s noisy, it’ll probably go to a chat where people don’t look as often!
- For parameters, be explicit - say
3600for thedefaultseconds run time, rather thandefaultthen loading in the number based on that string
CI (GitHub Actions)
Apart from linting, auto-fixing, formatting, etc. there are some really cool things you can do with GHA and GH
Have a fairly complex/tedious workflow for e.g. building docker images and performance testing them on a branch? Use ChatOps to listen to a command and let an Action do it for you
- It can reply with a comment, linking to the builds, perf tests, dashboards, etc.
- It can describe what process it is doing, for more explicit documentation
Use Chinthakagodawita’s autoupdate action to keep PR’s up-to-date with the
mainbranch- If you have
auto mergeenabled, you can use thePR_FILTERofauto_merge- Done reviewing 5 PRs? Hit auto merge on them, and this will keep them merging until they’re all done!
- Without this, you’d have to wait and press “merge from main” four times. That could be like 10-30 minutes being distracted!
- If you have
Open source contributions:
- Coursier’s
setup-actionis “A GitHub Action to install Coursier and use it to install Java and Scala CLI tools.”. It can set up various Java verisons and distributions.- We use Amazon Corretto at work, and AWS. I [added Corretto to the jvm-index repo](https://github.com/coursier/setup-action https://github.com/coursier/jvm-index/blob/master/src/Corretto.scala).
Docusaurus
I was familiar with Hugo’s Doks static site generator, and was happy to try a new SSG here: Docusaurus.
We were on Docusaurus 1, and we had a lot of complexity with the sidebar, document ordering, couldn’t use cool new plugins, etc. - so I was happy to simplify things and upgrade us to Docusuaurs 2. Here’s a few tips:
- Set up PR preview, so non-developers can see what their changes look like
- You might need to “recreate” the Action from scratch to avoid nesting (it’s a composite action) - see this issue
- Consider adding comments to your site, so people can reach out with the context directly above. utteranc.es can help with this
- Add light/dark src/css/custom.css to match the rest of your project’s branding
- For user-facing documentation, add a FAQ page. This could save a lot of time helping resolve confusion on your most common questions!
- When choosing document order, set weights like 0, 10, and 20. If you set 0, 1, and 2 then you can’t insert a document between any of them without changing many files. With the former setup, you can set “15” to get between 10 and 20.
Text search in Docusaurus
I also added text search, to help our users navigate straight to what their looking for - without having to look through the structure of our sidebar. I did this as a spike for fun on a “learning Friday” - and when it was nearly ready, our users were excited for it - it was apparently quite a headache for them. Once I figured it out, it was really simple! I raised documentation for this to make it easier for other people to get up to speed quickly with it too.
package.json adds e.g.
"dependencies": {
  "@cmfcmf/docusaurus-search-local": "^0.11.0",
  ...
}
docusaurus.config.js adds e.g.
plugins: [require.resolve("@cmfcmf/docusaurus-search-local")],
To see it locally, do yarn build and yarn serve. These make a production-like version of your site. yarn run dev does not integrate most of the search plugins (the search index is built on build only)
There’s also https://github.com/easyops-cn/docusaurus-search-local if you need it to be local/static. Algolia is popular, but it needs a server. See more in the Docusaurus docs
Meetings
- Enable closed captions
- Having the auto-generated subtitles should be accurate enough to help some of your team follow the conversation
- If the auto-generated subtitles are garbage, you probably need to spend some budget on upgrading microphones. If the computer can’t understand you, maybe humans are having an issue too!
Calendar
- If a meeting is recorded, but a link to the recording in the invite. It gives a real home to the recording, rather than just a Slack message that gets lost. Helpful for people coming back from holiday/sickness - can flick through Calendar and get straight into the meetings they need to catch up on
Build caching
Compiling your apps from scratch every time is a waste of time & energy. Some build tools support delta/partial compilation - if only 1 file in 1000 changed, we can base our compile around that. GitHub Actions has a few options for caching dependencies, e.g. https://github.com/actions/cache or https://github.com/coursier/cache-action. That could help a little. Some build tools have a remote cache - that’s great for quicker builds on CI. But, if you don’t have a remote cache - what can you do?
Our team uses our own mill build tool container. It already ran some basic checks to check it’d work with our project and could initialise some “workers” - but didn’t do any caching. Here’s what I did:
- Use a wrapper
millw, a bit likegradlew. This would allow the container to build for any.mill-version, by downloading the necessary tooling- If we merge a build tool upgrade in our main repo, builds would still work without requiring a manual rebuild on the new version of this image. Not technically efficient due to the redownloads of the build tool, but ultimately removing some toil in making things a little smoother for humans.
- Compile, check formatting, fixing, etc. to generate these outputs in
out, as well as downloading dependencies - To prevent being over-written, run
mv /root/build/out /root/out-cache. In Jenkins jobs for app builds, move this cache back (if the build is parameterised with using the cache). Dependencies cache doesn’t need moving. - The cache doesn’t have to be used. It adds some size, but storage is cheap and saved time/energy is valuable. We use it for PR builds (not
main- that’s clean), and
The outcome of this is that, several minutes are shaved off each module (more or less, each microservice) build time. Faster PR compilations means faster PR checks, which means delivering value faster and reducing our mean time to recovery. It also means faster builds for ChatOps triggering branch builds + perf tests, giving fast feedback on performance critical code changes!
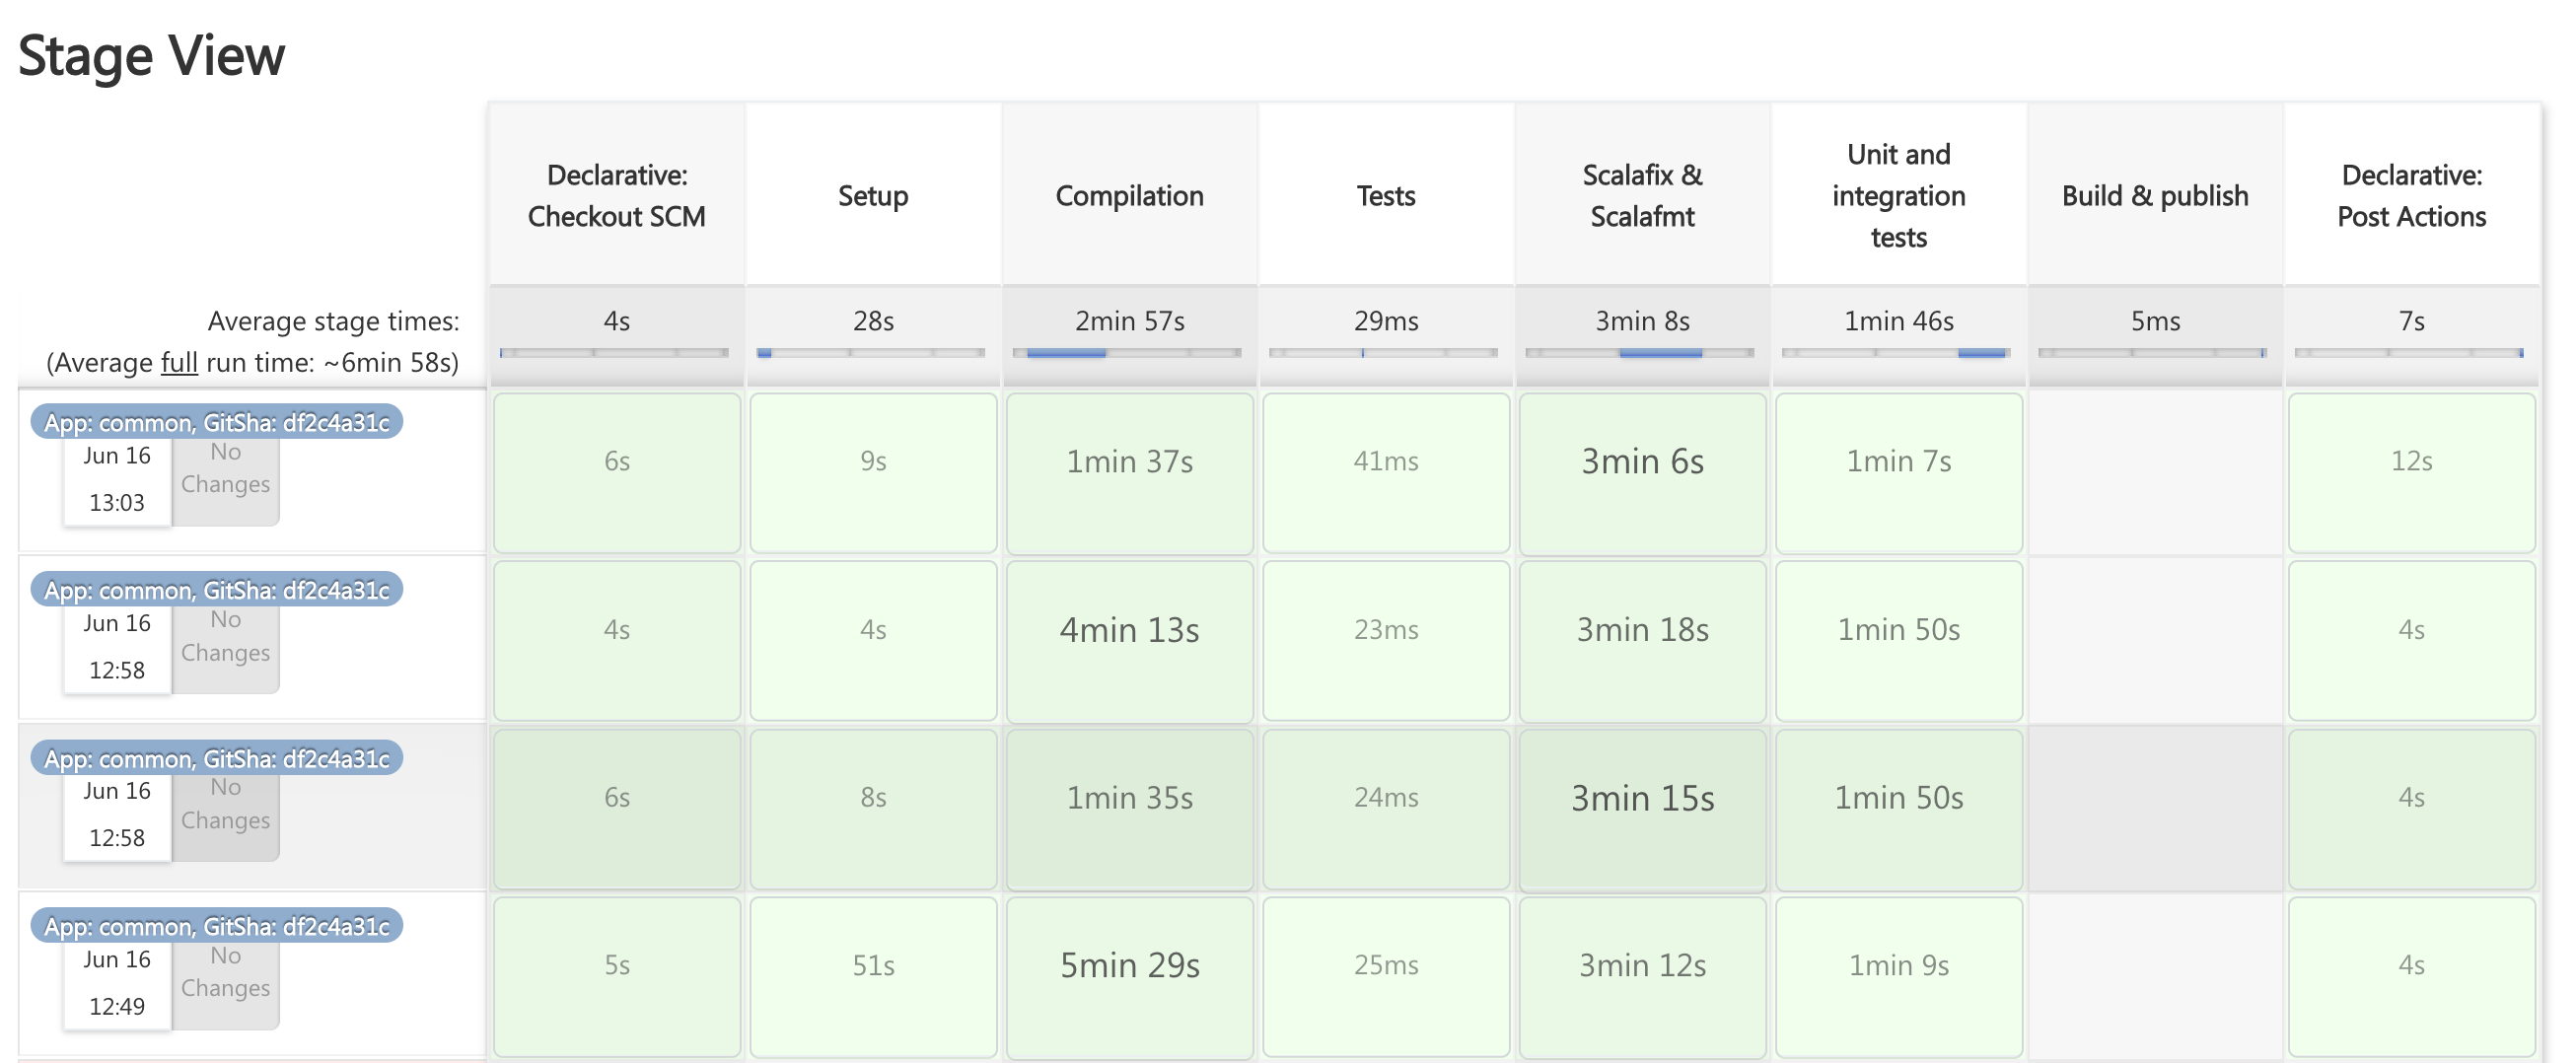
Can you guess which builds are using the cache?
I was pleased with doing this, as using deltas like this has seemed awesome to me for a long time. I was amazed as a teenager when one Android custom ROM could deliver OTA updates 10x smaller than anyone else, by using deltas.
Performance tests
In your performance testing platform (we use Gatling), consider what types of test you want to have, and what should be compared:
- nightly, load (main)
- I made them run for longer (why not? nobody is manually testing on the
perfenv at 3am) - I made them run at peak RPS for 75% of the run time (configurable). Previously, only about 20% of the time was at peak RPS. Choose a traffic shape gives your services a proper workout!
- I made them run for longer (why not? nobody is manually testing on the
- soak (main)
- Have seen dependencies clash and lead to slow memory leaks; soak tests protect us from this, run over the weekend
- I oversaw various performance test changes around this time after identifying improvements with the team in a post-mortem.
- Here, we basically decrease the load a little bit (75% of nightly) and run for much longer
- load (branch)
- results could be very far from average results on
main, so have separate simulation to keep your “usually good” simulations clean
- results could be very far from average results on
You can try different traffic shapes, e.g. a triangle wave over a day to simulate real traffic variety. How does your app perform as load varies?
We previously sent the reports to Slack, with pass/fail and the targets. I added time-stamped hyperlinks to observability dashboards for ergonomics.
Git hooks
Git hooks are great - ensure your code is linted/compilable/tested before pushing.
What’s even cooler is combining them with interactive CLI tooling like gum - see my “gummy hooks” examples.
- Iterate quicker by using a bash script and just calling it - you don’t actually have to do anything with Git to iterate on it.
Scala Steward
Not receiving updates
For Scala, a common tool for getting dependency upgrades (and new Scala versions!) is Scala Steward. For about half a year, only a few of our dependencies were getting updates. You may remember when Log4j had multiple security vulnerabilities (and corresponding patches) within about one week, in December 2021. This one was patched automatically. A few other dependencies weren’t being updated (note: I never saw security issues, or if we did we’d patch manually).
We were extracting a version and interpolating with it. The fix here was to declare each dependency and its version on its own line. It didn’t really make PRs harder to review, and is even a bit clearer in a PR to show you what really changed.
If you’re not getting updates with Scala Steward, that might be something to look into!
Not receiving updates… 2.0: Failed to decode Modules
If you have a big Mill Scala project (let’s say, a monorepo - with about 10 modules) and fair number of dependencies - you might be seeing this problem.
I ran a local clone of Steward with a teammate, adding some print-lines to diagnose the parser. We saw the input string for parsing was blank for our project. Looking at MillAlg.scala, we saw about 5000 lines of the end of a JSON object. The default buffer is 8192 bytes. Increasing the CLI argument --max-buffer-size to 32768 fixed the issue for us. The author also raised a PR to give a more obvious error about this, instead of returning some partial JSON.
Kinesis
With Kinesis, we were getting hundreds of thousands of errors per week -[metrics_manager.cc:145] Metrics upload failed- giving a very bad signal:noise ratio in our DataDog logs.
We only use metrics at the “stream” level, rather than the “shard” level (a stream has many shards, and shards can sometimes report no data & error).
On a KinesisProducerConfiguration, do .setMetricsGranularity("stream"). The default level is “shard”.
Also be mindful of costs. The Javadocs state that two shards with two streams each will produce seven CloudWatch metrics (4x shard, 2x stream, 1 global).
AWS support was not so helpful with this error (essentially saying: “it’s a known issue, but please work around it by filtering out the logs”) - setting a more accurate configuration is better, and I shared our recommendation on the issue.
On-call
With good tests (unit, integration, end-to-end, performance, etc.), you won’t get called out much and it might be worth the extra pay bump + other perks :)
gh CLI - downloading files, & using in GitHub Actions
curl $(gh api $URL_TO_FILE_ON_GITHUB) --jq .download_url) -o ./path/to/download.ext
If you install the gh CLI on you GitHub Action runners too, it can be a nice way to interact with your GitHub (enterprise works too!). You just need to set the enterprise token and GitHub Host as env variables.